Peptide HPLC purity explained
Short answerPeptide HPLC purity is the area of the target peptide peak divided by the total area of all integrated peaks in a reversed-phase chromatogram, usually at 214 to 220 nm. It measures the target against related peptide impurities, not water, counter-ions or how much peptide a vial contains.
Key facts
- Method
- Reversed-phase HPLC with UV detection
- Detection wavelength
- 214 to 220 nm, where the peptide bond absorbs
- Reported as
- Area percent of the main peak
- 98% purity
- Up to 2% of detected peak area is not the target
- 99% purity
- Up to 1% of detected peak area is not the target
- Not measured
- Water, counter-ions, inorganic salts, net peptide content
- Identity partner test
- Mass spectrometry
Peptide HPLC purity is the figure buyers quote most often and misread most often. This guide explains how reversed-phase HPLC produces the number, what 98% and 99% mean, which impurities sit behind the remaining percent and why purity is not content.
How peptide HPLC purity is measured
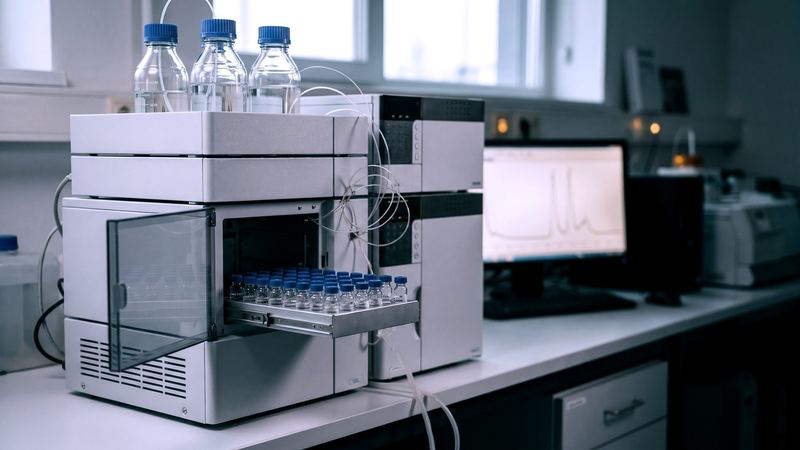
Reversed-phase high-performance liquid chromatography (RP-HPLC) separates molecules by hydrophobicity.
- A small amount of dissolved sample is loaded onto a column packed with silica particles bonded to hydrocarbon chains, usually C18.
- A mobile phase flows through the column. It starts mostly aqueous and becomes richer in organic solvent, normally acetonitrile, over a programmed gradient.
- An acidic modifier, commonly 0.1% trifluoroacetic acid or formic acid, sharpens the peaks.
- Each species leaves the column at a characteristic retention time. More hydrophobic species leave later.
- A UV detector records absorbance, usually at 214 to 220 nm, where the peptide bond absorbs.
- Software integrates the area under each peak.
Purity is then calculated as:
Purity (%) = main peak area ÷ total integrated peak area × 100
This is area percent, sometimes called area normalization. It assumes that the target and its impurities absorb similarly at the detection wavelength. That assumption is reasonable for closely related peptides and weaker for impurities that have lost or gained an aromatic residue.
| Method parameter | Typical choice | Why it matters |
|---|---|---|
| Column | C18, wide-pore for longer peptides | Sets selectivity and resolution |
| Mobile phase | Water and acetonitrile with acid modifier | Controls retention and peak shape |
| Gradient slope | Shallow for closely related impurities | A steep gradient can hide impurities under the main peak |
| Wavelength | 214 to 220 nm | Detects all peptide bonds; 280 nm sees only aromatic residues |
| Column temperature | Controlled | Shifts retention and resolution |
| Integration rules | Threshold and baseline settings | Decide which small peaks are counted |
A certificate should state these conditions. Validation of analytical procedures is described in ICH Q2, listed among the ICH quality guidelines.
What 98% vs 99% purity means
| Stated purity | Maximum share of peak area from other species | Typical use of the grade |
|---|---|---|
| Above 95% | Below 5% | General laboratory work |
| Above 98% | Below 2% | Common specification for research-grade stock |
| Above 99% | Below 1% | Tighter specifications; higher cost |
Three cautions apply.
The number belongs to the method. A steep gradient on a short column can report 99% for material that a shallow gradient would report as 97%. Compare chromatograms, not headline figures.
Individual impurities matter. A specification can limit total impurities and the largest single impurity. A lot at 98.5% with one impurity at 1.2% differs from a lot at 98.5% with six impurities near 0.2% each.
Higher purity costs yield. Each tighter cut in preparative HPLC discards more product, which is one reason price rises with grade. See wholesale peptide pricing.
Pharmacopoeial and regulatory expectations for specifications, including impurity limits, follow the principles in ICH Q6A, although that guideline does not address synthetic peptides specifically.
Which impurities are common in synthetic peptides
Impurities come from two sources: the synthesis and later degradation. The steps where each arises are described in peptide synthesis explained.
| Impurity | How it forms | Mass change | Separation by RP-HPLC |
|---|---|---|---|
| Deletion sequence | One coupling fails; the chain continues without that residue | Minus one residue | Usually resolved; difficult for small residues such as glycine |
| Truncated sequence | Chain growth stops, often after capping | Minus several residues | Usually well resolved |
| Insertion sequence | A residue couples twice | Plus one residue | Usually resolved |
| Incomplete deprotection | A side-chain protecting group remains after cleavage | Plus the protecting group | Well resolved; elutes later |
| Oxidation | Methionine, tryptophan or cysteine reacts with oxygen | Plus 16 Da for methionine sulfoxide | Usually resolved; elutes earlier |
| Deamidation | Asparagine or glutamine converts to the acid form | Plus 1 Da | Often partly resolved |
| Aspartimide and isoaspartate | Aspartic acid cyclizes with the backbone, then reopens | Minus 18 Da, or no change | Often poorly resolved |
| Racemization | An L-amino acid converts to the D form, notably histidine and cysteine | None | Often co-elutes; needs a dedicated method |
| Dimers and aggregates | Disulfide bridges or non-covalent association | About double | Better assessed by size-exclusion methods |
| Reagent adducts | Side reactions with cleavage or coupling reagents | Varies | Usually resolved |
Two points follow. Mass spectrometry and HPLC are complementary: an impurity with no mass change, such as a racemized peptide, is invisible to a simple mass check, and an impurity that co-elutes is invisible to HPLC. That is why a certificate reports both. Second, degradation products such as oxidized and deamidated forms can grow during storage, so purity at release is not purity forever. See peptide storage and cold chain.
Why purity is not content
Purity and content are different numbers. Purity says how much of the peptide present is the right peptide. Content says how much peptide is in the vial. A lot can pass one and fail the other. Check both against the label quantity.
A vial can be 99% pure and hold much less peptide than its label states. The purity figure would not show it, because purity only describes the peptide that is there. The content result, set beside the quantity printed on the label, is the check for an underfilled or diluted lot.
HPLC with UV detection reports the composition of the peptide fraction. It says nothing about the non-peptide mass in the powder.
| Component of lyophilized powder | Seen by HPLC-UV purity | Measured by |
|---|---|---|
| Target peptide | Yes | HPLC |
| Related peptide impurities | Yes | HPLC |
| Counter-ion, such as acetate or trifluoroacetate | No | Ion chromatography or HPLC |
| Water | No | Karl Fischer titration |
| Residual solvents | No | Gas chromatography |
| Inorganic salts | No | Residue on ignition or ion analysis |
Net peptide content is the mass fraction of the powder that is peptide. It is measured by amino acid analysis or nitrogen determination. A lot can be 99% pure by HPLC and contain substantially less than 99% peptide by mass. Both figures are correct, because they measure different things.
The practical consequence is in the fill. If a vial's stated quantity is gross powder, the amount of target peptide is lower than the stated quantity by the counter-ion and water share. Ask the supplier which basis the stated quantity uses. The worked example is in how to read a peptide COA.
How to read a chromatogram
| What to look at | What it tells you |
|---|---|
| Main peak shape | A symmetrical peak suggests one species; a shoulder suggests a co-eluting impurity |
| Baseline | A flat baseline supports reliable integration; drift can hide small peaks |
| Peaks before the main peak | More polar species, such as oxidized forms and truncations |
| Peaks after the main peak | More hydrophobic species, such as protected peptides |
| Integration table | Retention time and area percent for every counted peak |
| Run time and gradient | Whether the separation was long enough to resolve close impurities |
| Solvent front | The early peak from the sample solvent, normally excluded from integration |
Recalculate purity from the integration table. If the stated purity does not match the main peak's area percent, ask why.
What to ask a supplier about purity
- The purity limit in the specification and the result for this lot.
- The method conditions: column, gradient, wavelength.
- The limit for the largest single impurity.
- Whether net peptide content is reported separately.
- Which laboratory ran the test, and whether it is accredited to ISO/IEC 17025 for the method.
- Whether the chromatogram and mass spectrum are supplied with the certificate.
Every lot from International Wholesale Peptides ships with a certificate of analysis that names the testing laboratory and reports identity by mass spectrometry, purity by HPLC and peptide content. The certificate of analysis page shows the format, and the quality page describes the test panel.
Frequently asked questions
What does 99% HPLC purity mean for a peptide?
It means the main peak accounts for 99% of the total integrated peak area under the stated method and wavelength. Up to 1% of the detected signal comes from other peptide-related species. It does not mean that 99% of the powder's mass is the target peptide.
Is 98% purity very different from 99%?
The impurity allowance doubles, from 1% to 2% of peak area. Whether that matters depends on the application and on which impurities are present. The figures are only comparable when the method, column, gradient and integration rules are similar, so read the chromatogram, not just the number.
Why is HPLC purity not the same as peptide content?
UV detection sees peptide bonds and aromatic groups. It does not see water or counter-ions such as acetate, which can make up a significant share of a lyophilized powder. Net peptide content is measured separately, by amino acid analysis or nitrogen analysis.
What are the most common peptide impurities?
The usual process-related impurities are deletion sequences, truncated sequences and incompletely deprotected peptides. The usual degradation products are oxidized, deamidated and aggregated forms. Racemized peptides, which contain a D-amino acid in place of an L-amino acid, are harder to separate and may co-elute with the main peak.
Can two labs report different purity for the same peptide lot?
Yes. Different columns, gradients, temperatures, wavelengths and integration settings resolve and count impurities differently. Differences of a few tenths of a percent are normal. A large difference, or a main peak at an unexpected retention time, should be investigated with the laboratories.
Does HPLC confirm that the peptide is the right one?
Not by itself. Retention time supports identity only when compared with a reference standard run under the same conditions. Identity is confirmed by mass spectrometry, which compares the observed molecular mass with the theoretical mass of the sequence.
Related pages
 How to read a peptide COATo read a peptide COA, match the lot number to the label, confirm identity by comparing observed and theoretical mass, read HPLC purity as…How peptides are synthesized: from resin to lyophilized powderMost commercial peptides are made by Fmoc solid-phase peptide synthesis: amino acids are coupled one at a time to a chain anchored on resin,…Peptide certificate of analysis: what ours shows and how to verify itA peptide certificate of analysis should name the product, lot number, manufacturing origin and testing laboratory, and report identity by mass spectrometry, purity by…Peptide quality testing and documentationEvery International Wholesale Peptides lot ships with a certificate of analysis that names the testing laboratory and reports identity by mass spectrometry, purity by…